
Project Case

MAPPING 10Y MARKET EVOLUTION FOR STRATEGIC GROWTH DECISIONS

Foresight Strategy

Challenge

A global provider of  instruments and measurement technology needed a clearer view of how it's relevant markets would evolve over a 10-year horizon.

Without an integrated view of total addressable market versus current revenue, the client lacked the means to identify structural growth engines, anticipate passive market-share erosion, or make confident board-level decisions about where to invest.

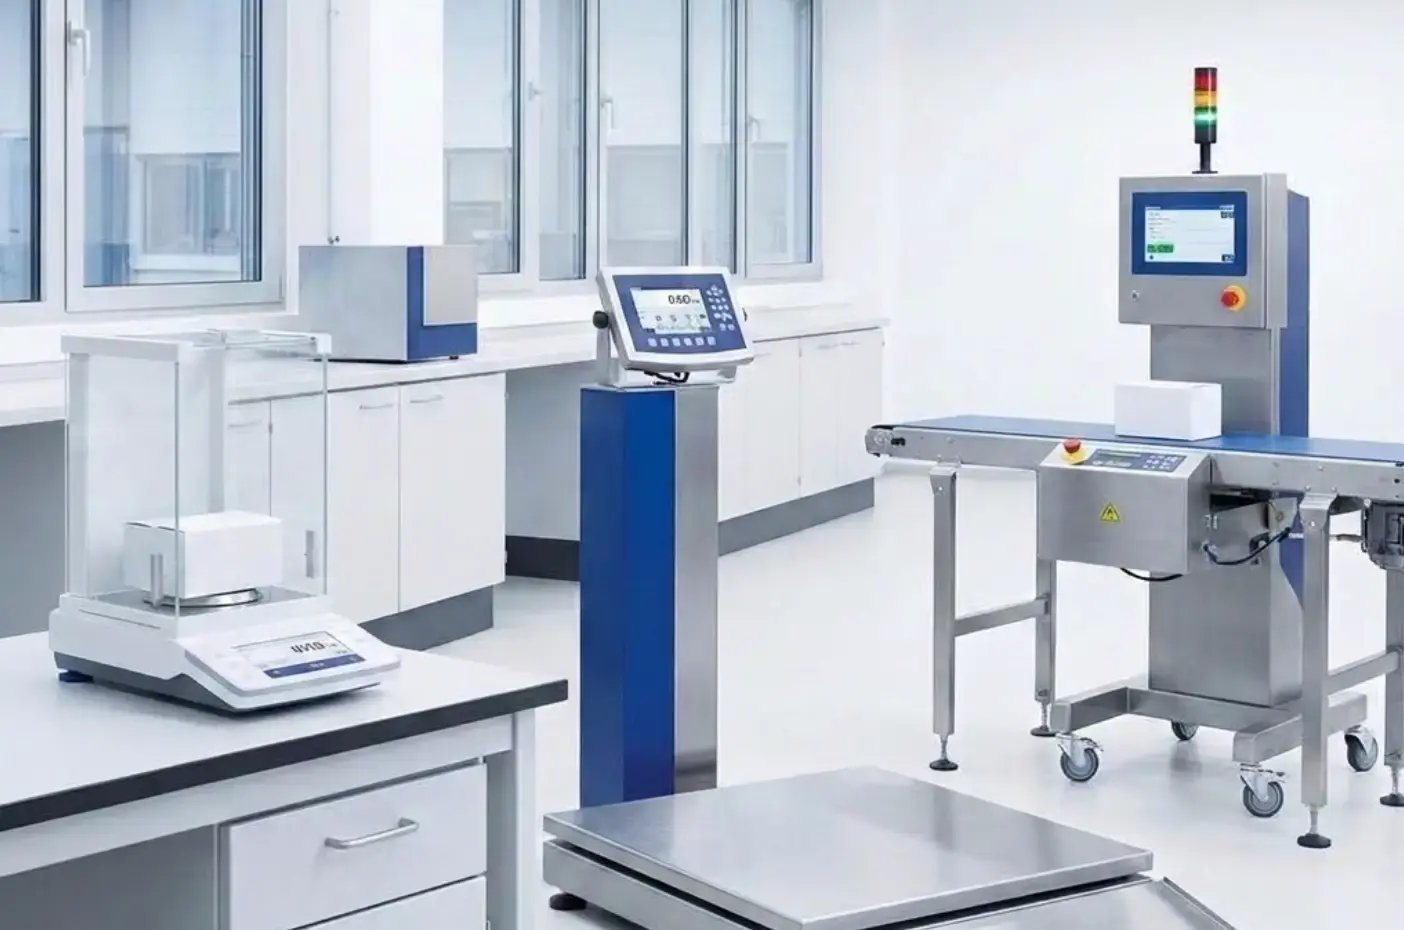
A laboratory and industrial weighing equipment setup, representing precision measurement solutions across manufacturing environments.
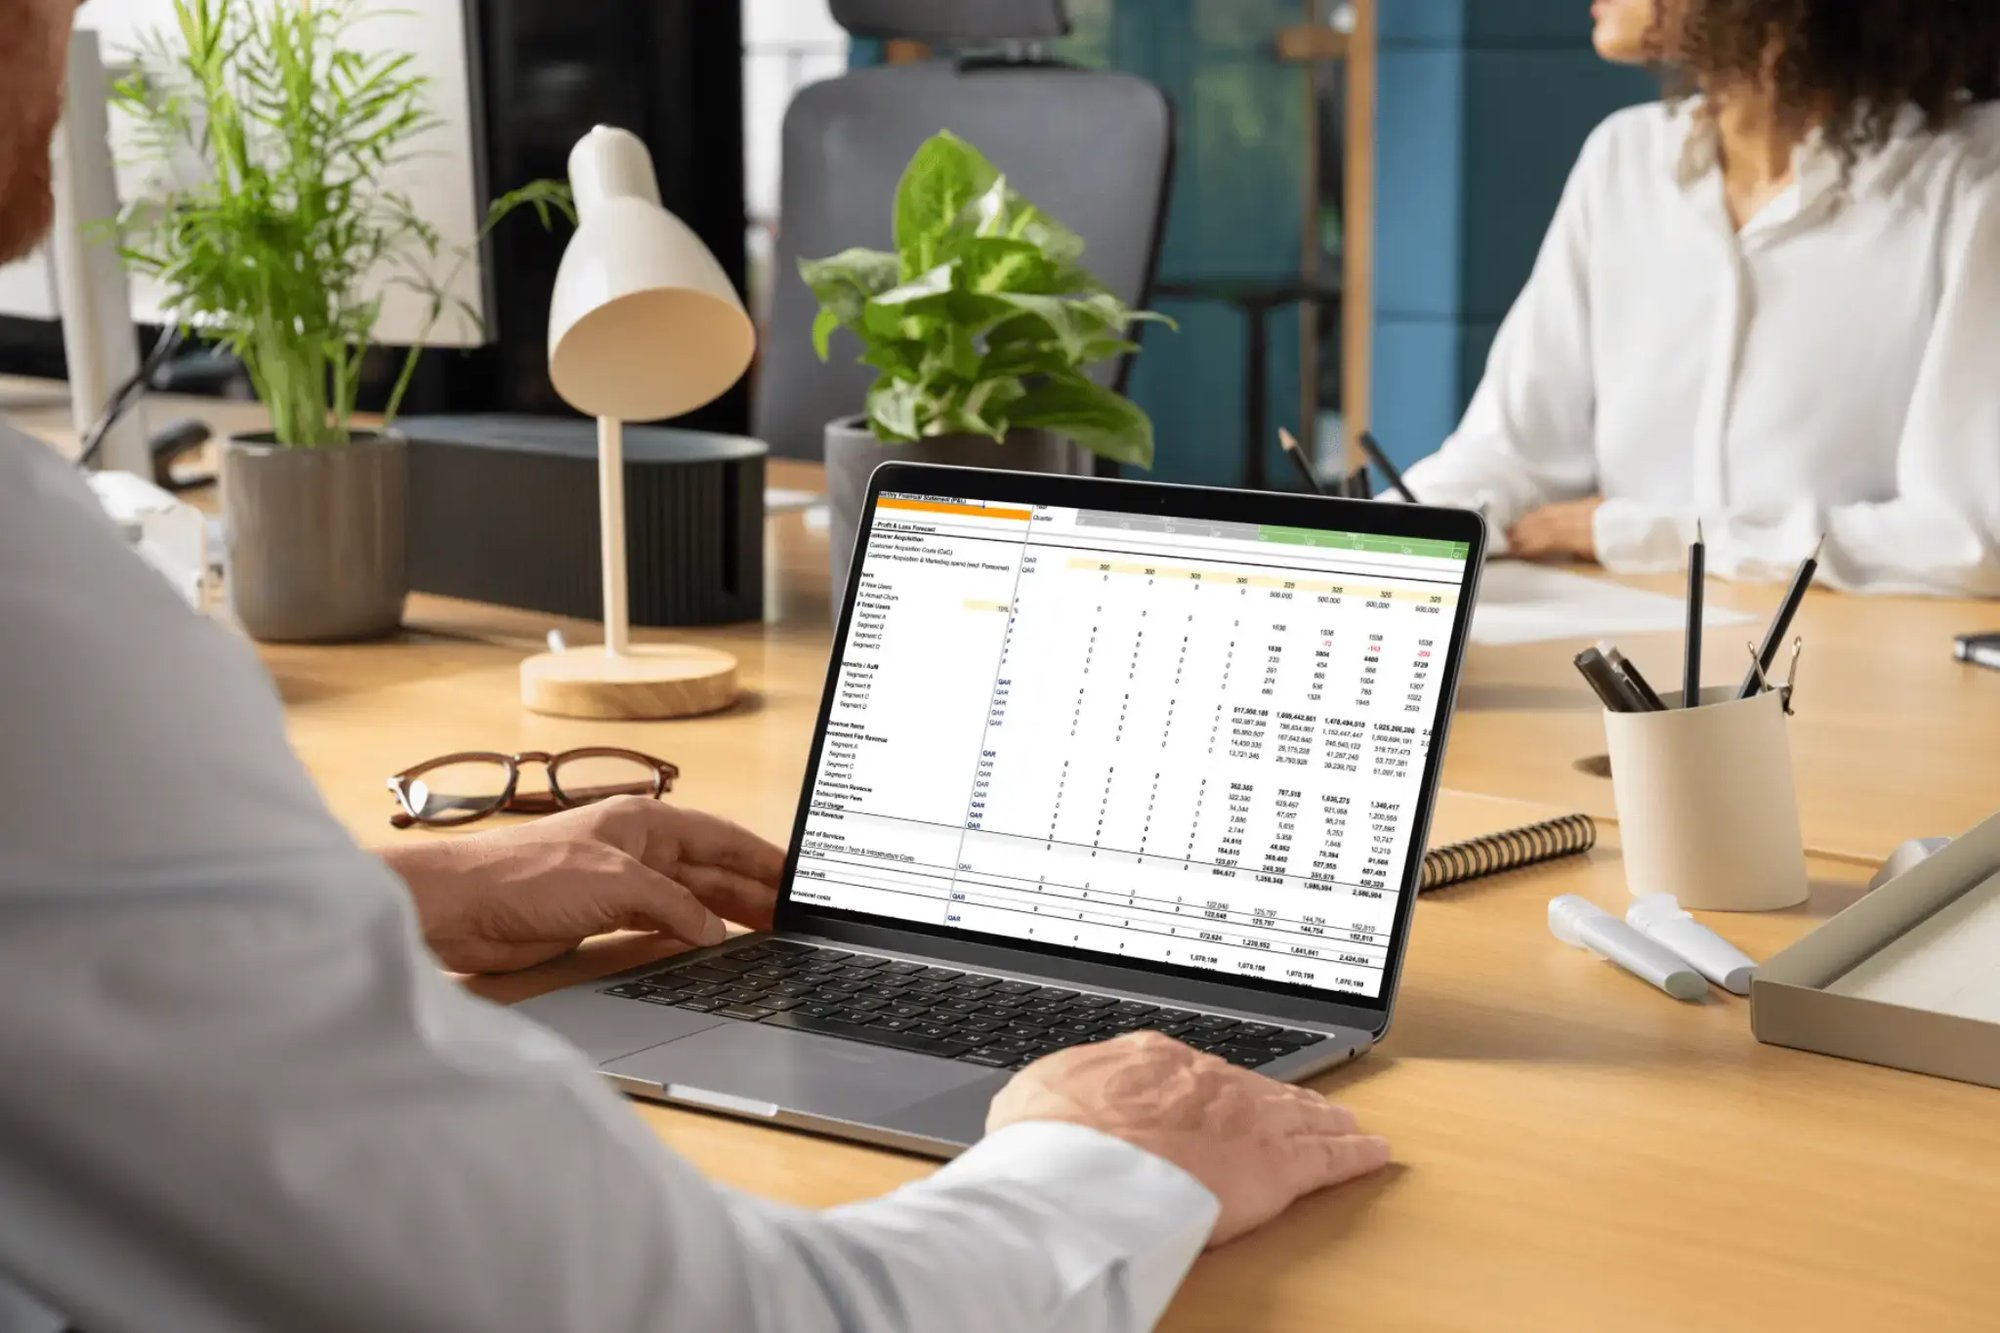
A business professional reviewing a dynamic financial model on a laptop, representing the data-driven approach used to map 10-year market evolution across industrial segments.

Approach

We developed an excel-based MVP Dynamic Foresight Model using a dual sizing methodology:

  • a top- down approach drawing on macroeconomic data and manufacturing value added,

  • combined with a bottom-up build using production site counts, equipment density, and unit economics.

The model covers a 10-year projection period across 8 industrial segments and 36 sub-segments, with Base, Best, and Worst Case scenario toggles.

Outcome

The model gave the client a transparent, data-driven foundation for strategic planning and board-level decision-making::
_TAM mapping across 8 industries & 36 sub-segments, quantifying over- or under-indexing
_Gap analysis identifying structural growth engines versus markets in passive decline
_Scenario simulation enabling stress-testing key assumptions across a 10-year horizon

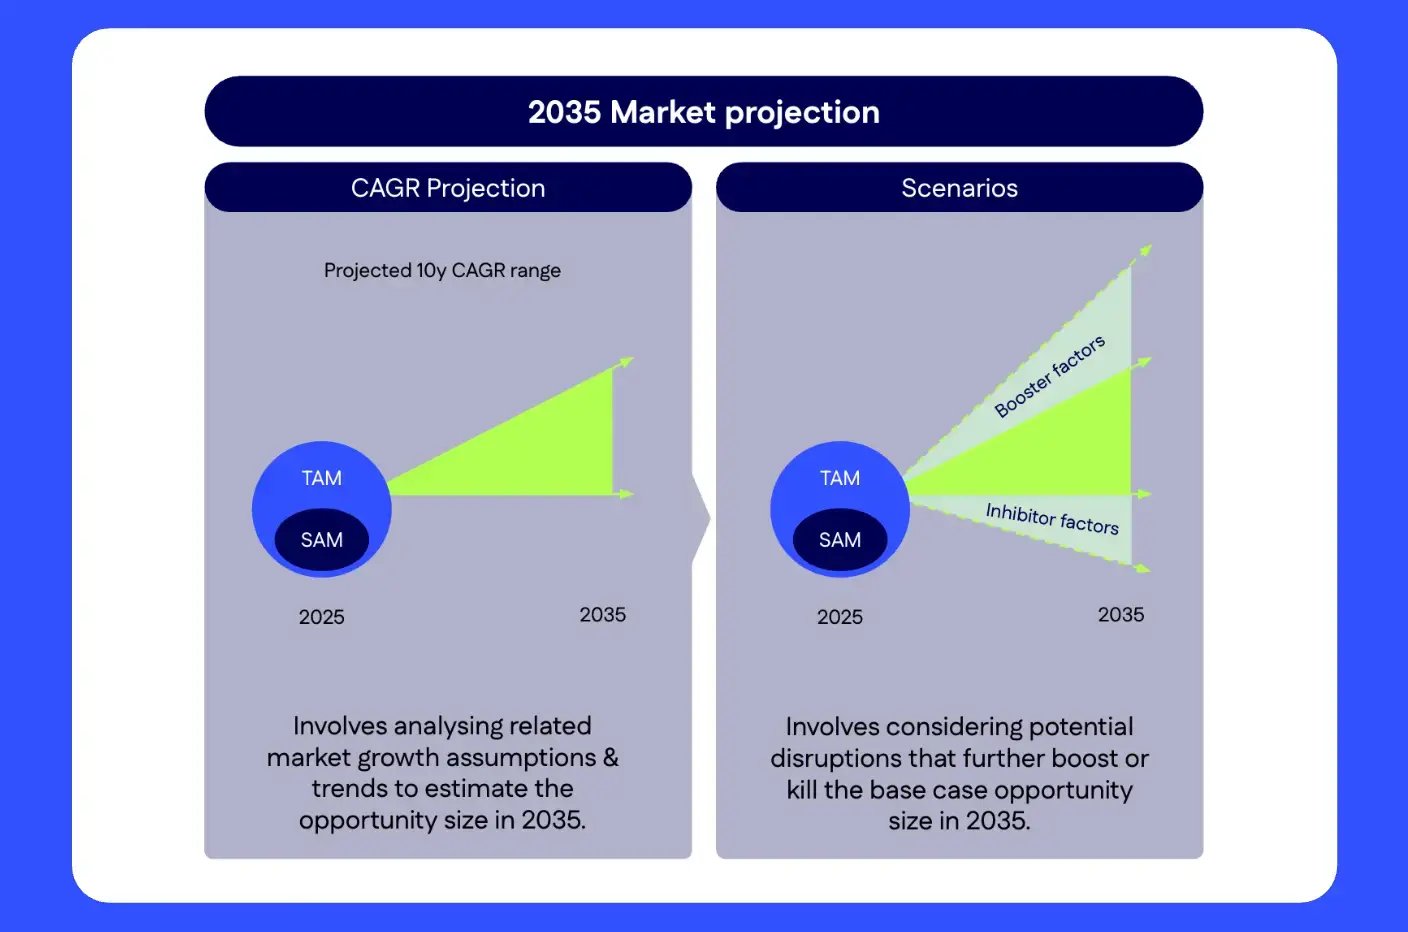
A 2035 market projection diagram showing CAGR projection and scenario analysis with booster and inhibitor factors, used to support board-level strategic growth decisions.
10

years Foresight horizon


8

Industrial segments covered

36

Sub-segments modelled

1900

Data combinations